PDES scaling
Measured scaling of single-run PDES sharding — the Phase 3
capability. Every number here is measured; the charts are rendered from the
recorded data by scripts/generate_perf_charts.py, and the slowdown regimes
are stated alongside.
Measurement setup
- Benchmark:
benchmarks/pdes_scaling.py— a balanced serpentine grid conveyor (~410k events), timing fulltopo.run()wall clock including barriers, versus the sequential reference runner. - Machine: Apple M5 (4P+6E), macOS, CPython 3.14.2t unless noted.
- Correctness is unconditional — the bitwise trace-equivalence suite gates every build at 1/2/4/8 shards plus a jittered soak; these are the performance record only.
Shard scaling
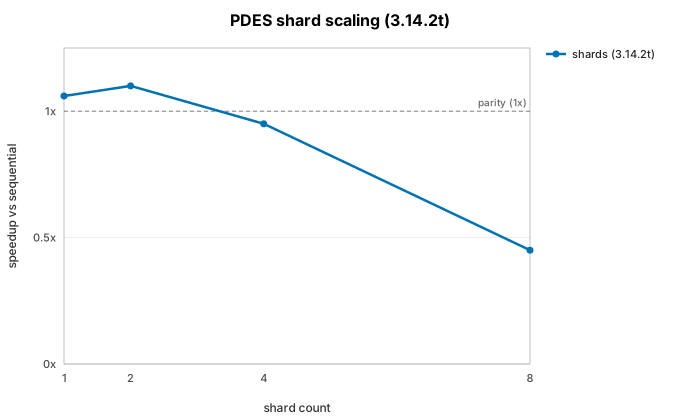
Speedup peaks at 1.10× at 2 shards and falls away (0.95× at 4, 0.45× at 8).
Status of the ≥3×-at-8-shards roadmap figure
Not demonstrated on current interpreters, as the Phase 3 spec anticipated. PDES shards are threads running the Phase 1 engine hot loop concurrently, and CPython 3.14.2t's reference-count contention on shared objects (the same ceiling the replication threads backend hits) caps thread-parallel DES at ~1.1× regardless of the synchronizer's quality. The figure will be asserted when a CPython build scales pure-Python event loops across threads. GIL build for comparison: 0.90× at 2 shards — correct, time-sliced, prominently warned.
Lookahead degradation
The textbook conservative-PDES slowdown regime. On a 4-shard ring with local event spacing 0.25, wall clock is plotted against the lookahead / mean-spacing ratio (relative to the L=4× sequential run):
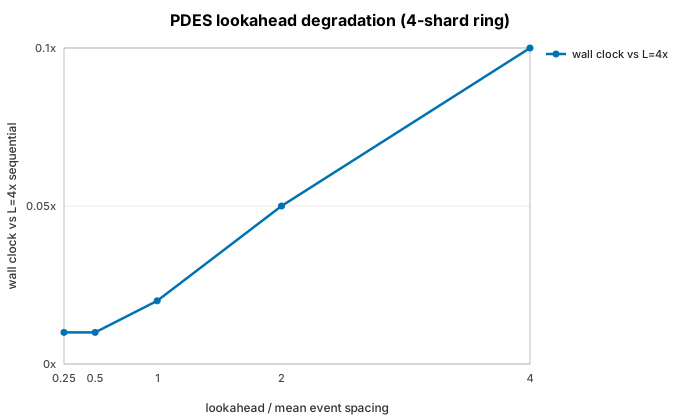
The horizon advances at most one lookahead per round, so halving lookahead
doubles the number of barrier rounds — the wall clock doubles down the whole
sweep. With lookahead at or below the mean event spacing, a sharded run is
dominated by synchronization and is strictly slower than sequential. Use
llmsim.parallel.pdes.analyze() on a sequential trace to estimate the window
economics before partitioning.
Slowdown regimes
- Low lookahead — see the sweep above; lookahead must be a large multiple of the mean event spacing for windows to carry meaningful work.
- Unbalanced shards — the window cost is the busiest shard's; a 90/10 split
caps speedup at ~1.1× no matter the core count (
analyze()reports this asbalance_speedup). - GIL builds — time-sliced threads: correct, warned at runtime, never faster than sequential.
- 3.14.2t thread contention — the interpreter-level ceiling above; today it dominates every other regime on free-threaded builds.
The full narrative and the CI regression gate are in the Performance overview.