Replication scaling
Measured throughput of parallel replications — the
Phase 2 capability — as worker count grows. Every number here is measured;
the charts are rendered directly from the recorded data by
scripts/generate_perf_charts.py, and the slowdown regimes are stated
alongside (mission principle 3: honest performance claims).
Measurement setup
- Benchmark:
benchmarks/replication_scaling.py— 64 replications of an ~20 ms M/M/1, timingExperiment.runwall clock including executor startup and result transport, versus a pure in-process sequential loop. - Machine: Apple M5, 10 physical cores (4 performance + 6 efficiency), macOS.
- Builds: CPython 3.14.2 (GIL) and 3.14.2t (free-threaded).
- Signal: ratios (speedup vs sequential) are the portable signal; absolute times are hardware-specific. Correctness is unconditional and gated separately — these are the performance record only.
Free-threaded build (3.14.2t)
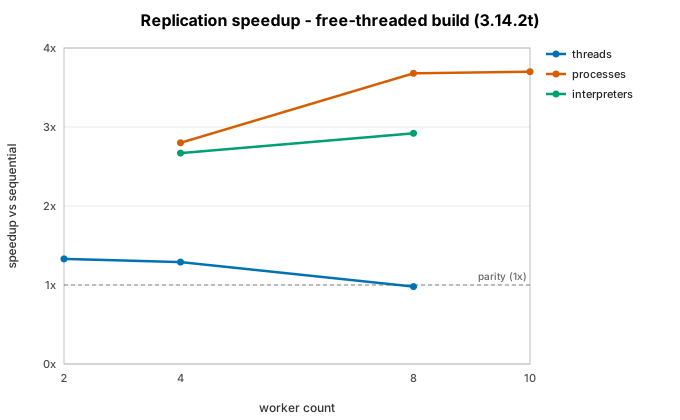
On the free-threaded build the processes backend reaches 3.70× at 10
workers, while the threads backend peaks at 1.33× (2 workers) and then
degrades to 0.98× at 8.
GIL build (3.14.2)
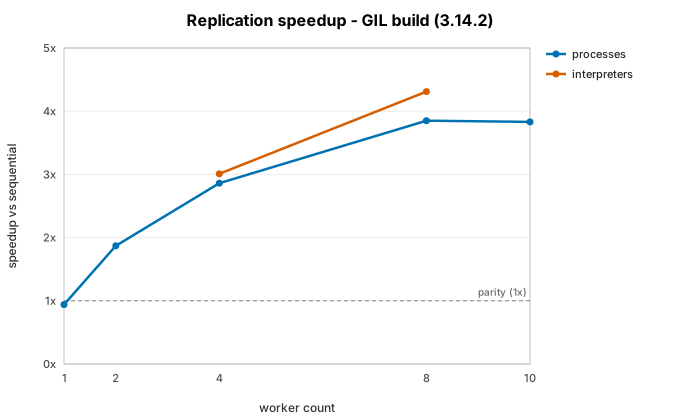
On the GIL build auto picks processes; interpreters reach 4.31× at 8
workers and processes 3.85×.
For context, an embarrassingly parallel pure-CPU baseline measures 4.69× at 8 workers on this machine — the 4P+6E core asymmetry, not coordination overhead, is the dominant cap. The process backend reaches ~80–90% of that ceiling.
Status of the ≥6×-on-8-cores roadmap target
Not yet demonstrated, honestly. This 10-core machine is heterogeneous (4P+6E); even perfect scaling cannot show 6× at 8 workers here. The measured per-core efficiencies (0.94×/core at 2 workers, 0.72–0.77×/core at 4) are consistent with ≥6× on 8 homogeneous performance cores, but per the docs-honesty rule that figure is recorded only when measured on such a machine.
Slowdown regimes
- Threads anti-scale for DES event loops on 3.14.2t. The engine's and
random.py's hot paths repeatedly touch objects shared by every thread, and reference-count cache-line contention currently outweighs the parallelism (1.33× at 2 workers → 0.98× at 8). Usebackend="processes"for replication studies even on the free-threaded build. - Process startup dominates small studies. A study whose total sequential
runtime is under ~1 s can be slower with processes than sequentially
(
workers=1measures 0.94×). Size studies to seconds. - Result transport is per-replication overhead. On the process and
interpreter backends every config and result crosses a pickle boundary
(zstd-compressed when
spool=True). Return KPIs, not raw traces. - Efficiency cores flatten the top of every curve. Beyond the number of
performance cores each extra worker adds only a fraction of a core's
throughput;
max_workers = physical coresis the sweet spot.
The full narrative, the CI regression gate, and RSS guidance are in the Performance overview.